


In this article, we will learn how to monitor Java-based applications and solutions with Prometheus, you can also create dashboards with those metrics in grafana which will be a second part in this article.
So what in the world is prometheus?? definitely not a science fiction horror film directed by Ridley Scott in 2012 :p
Prometheus is an open-source monitoring and alerting tool. Grafana is also an open-source project mainly used for reporting. In Grafana, one can create dashboards for clean and clear visualization. Prometheus and Grafana are mostly used together.
In Simple words, Prometheus for gathering data and Grafana for visualization.
Without any delay lets get started and all we need is few dependencies which you can get them from spring initializr (start.spring.io)
If you're using anything greater than spring 2+ the following would be sufficient apart from starter dependency
Dependencies :
            <groupId>org.springframework.boot</groupId>
            <artifactId>spring-boot-starter-actuator</artifactId>
            <exclusions>
                <exclusion>
                    <groupId>org.springframework.boot</groupId>
                    <artifactId>spring-boot-starter-logging</artifactId>
                </exclusion>
            </exclusions>
        </dependency>

        <dependency>
            <groupId>io.micrometer</groupId>
            <artifactId>micrometer-registry-prometheus</artifactId>
        </dependency>
Setting Up Configuration via Properties or YAML :
Once you're done importing, head to the application properties file or yaml file in src/main/resources and add the following
management.application.name= Spring Boot-Prometheus-Starter Example
management.server.port=9099
management.context-path=/insights
management.endpoints.web.base-path=/insights
management.server.servlet.context-path=/
management.endpoints.web.exposure.include=*
management.endpoints.prometheus.enabled=true
management.security.enabled=false
management.endpoint.metrics.enabled=true
management.endpoint.health.show-details=always
management.endpoints.enabled-by-default=true
management.endpoints.hypermedia.enabled=true
management.endpoints.shutdown.enabled=true
management.info.git.mode=full
management.metrics.export.prometheus.enabled=true
This is all about enabling your prometheus endpoint, setting up at which port it should come up, you can even customize the prometheus endpoint name by giving endpoints.prometheus.id: myprometheus
By default all the metrics will be exposed to /prometheus, so I'm changing them to be exposed them at /insights/prometheus, as it would be clear and meaningful name, also it's a good practice having some clean names, corporate wants everything should be meaningful :p
Code Configuration :
Ah, this is gonna be very simple, you can complete the coding all the required part before you sip your coffee completely, ngl
This is gonna be your main configuration where you register your MeterRegistryCustomizer bean and add few meaning details that can be exposed to prometheus UI, I have attached piece of snippet for reference below, so you could imagine how it does actually look.
import io.micrometer.core.instrument.MeterRegistry;
import org.springframework.beans.factory.annotation.Value;
import org.springframework.boot.actuate.autoconfigure.metrics.MeterRegistryCustomizer;
import org.springframework.boot.info.BuildProperties;
import org.springframework.context.annotation.Bean;
import org.springframework.context.annotation.Configuration;

@Configuration
public class MicrometerConfig {
    public static final String SERVICE_NAME = "service";
    public static final String ENVIRONMENT = "environment";

    private final BuildProperties buildProperties;
    private final String environment;
    private final String artifactId;

  public MicrometerConfig(
            final BuildProperties pBuildProperties,
            @Value("${env}") final String pEnvironment) {
        buildProperties = pBuildProperties;
        environment = pEnvironment;
        artifactId = buildProperties.getArtifact().replace('-', '_');
    }

   @Bean
    MeterRegistryCustomizer<MeterRegistry> registerCommonTags(
            @Value("${management.application.name}")
                    String applicationName
    ) {
        return registry -> registry.config()
                .commonTags(
                        "" + ENVIRONMENT, environment,
                        "" + SERVICE_NAME, artifactId,
                        "application", applicationName,
                        "build.group", buildProperties.getGroup(),
                        "build.artifact", buildProperties.getArtifact(),
                        "build.version", buildProperties.getVersion());
    }

}
So we annotated this class with @Configuration which means that class declares one or more @Bean methods and may be processed by the Spring container to generate bean definitions and service requests for those beans at runtime.
Next we declared few variables to know the service name (as our's is a microservices architecture we define it as service), next is environment, be it production or local or QA etc.,
The next part is constructor, it doesn't need any introduction, and yeah always prefix your constructor variables with 'p' so that it would be more readable.
The last is customizing your meter-registry with all the enough details, you would need them because in the large era systems where hundreds of micro services be running at same time it would be very hard to know for which service is this metric for?
So in a nutshell it will display the environment in which it is running, service name, application name which is injected by properties,
{application="Spring Boot-Prometheus-Starter Example", build_artifact="spring_boot_prometheus_starter_example" ,build_group="com.spring.boot.prometheus.config.metrics", build_version="21.12.1.5",environment="qa", service="spring_boot_prometheus_starter_example"}
Sample Implementation :
Define an interface like below and have a method, naming is your choice
public interface MetricCollecting {
    void increment(MetricType type);
}
Now lets implement this interface and have a simple counter like below
import io.micrometer.core.instrument.MeterRegistry;
import org.springframework.stereotype.Component;

@Component("metrics-collector")
public class MetricCollector implements MetricCollecting {

    private final MeterRegistry registry;

    public MetricCollector(final MeterRegistry pRegistry) {
        registry = pRegistry;
    }

    @Override
    public void increment(final MetricType type) {
        registry.counter(type.getMetricName()).increment();
    }
}
What we are doing here is , we are implementing our interface and overriding the method we defined , with help of meter registry, we are registering the counter of our custom metric type and saying that it should be incremented whenever its called. Makes sense right?
Lets define some custom metrics such as suppose we want to know how many order-requests were in sent, cancelled, failed status
import lombok.Getter;

@Getter
public enum MetricType {

    SENT(MetricElements.Status.Types.Sent.KEY)
    CANCELLED(MetricElements.Status.Types.Cancelled.KEY),
    FAILED(MetricElements.Status.Types.Failed.KEY),
    ;

    private final String metricName;

    MetricType(final String pMetricName) {
        metricName = pMetricName;
    }
}
Time for having your metric name to defined or exposed to prometheus
public abstract class MetricElements {
    public static abstract class Status {
        public static abstract class Types {
            public static abstract class Cancelled {
                public static final String KEY = "status.type.cancelled";
            }
             public static abstract class Failed {
                public static final String KEY = "status.type.failed";
            }
            public static abstract class Sent {
                public static final String KEY = "status.type.sent";
            }

        }
    }
}
If you don't want all this, just declare some constant variable and give the name
ex: private static final String MY_METRIC_NAME = "your.metric.name"
But who knows there might be some other custom metric that needs to be added and you just add another constant variable in your class, If its you, you know where you have added that variable previously, If its someone else working on that, he would need to know search for that particular class which is not at all encouraged.
So better to have them in separate files with clear name and its reponsibility should be added so that in future it will definitely help for other developer who is on working on that. Nobody wants to waste for searching some variables right? Also it will help your code base maintain clean.
Once all this done, you just need to inject this in your class that responsible for particular function. Suppose I want to have count for sent status, I have a class that handles this work, So I just go that particular class
public class StausSentExample {

// some of your variables
 private final MetricCollecting metrics;

// constructor
 public StausSentExample
            (@Qualifier("metrics-collector") final MetricCollecting pMetrics) {
         metrics = pMetrics;
    }

 public void processSentStatusExample {

       // your code that does job of your choice
        metrics.increment(MetricType.SENT);

   }
}
Lets try to run the application, open the browser and hit
http://localhost:9099/insights/prometheus
You will be able to see bunch of metrics defined by default, if you don't see your metric, have some static data and run it again, so that the counter can be increment, or suppose if its an api, hit the api from browser, later refresh the prometheus it will show count as 1.0
And one more thing, by default prometheus converts the metrics name from "status.type.cancelled" to "status_type_cancelled" and _total will be suffixed.
EXAMPLE :
# HELP status_type_sent_total
# TYPE status_type_sent_total counter
status_type_sent 0.0
Running from docker :
Lets try to run it from docker instead of downloading stuff locally. This is easy :p
Make sure to have the following prometheus.yml file in your src/main/resources/ if you’re running it in your system.
# my global config
global:
  scrape_interval:     15s # Set the scrape interval to every 15 seconds. Default is every 1 minute.
  evaluation_interval: 15s # Evaluate rules every 15 seconds. The default is every 1 minute.
  # scrape_timeout is set to the global default (10s).

# Load rules once and periodically evaluate them according to the global 'evaluation_interval'.
rule_files:
# - "first_rules.yml"
# - "second_rules.yml"

# A scrape configuration containing exactly one endpoint to scrape:
# Here it's Prometheus itself.
scrape_configs:
- job_name: 'prometheus'
#  # metrics_path defaults to '/metrics'
#  # scheme defaults to 'http'.
  static_configs:
  - targets: ['127.0.0.1:9090']
- job_name: 'spring-prometheus-example'
  metrics_path: '/insights/prometheus'
  #scheme: https
  scrape_interval: 5s
  static_configs:
#  - please update ip according to your local docker address.
#  - port number is on which your application is currently running.
  - targets: ['192.168.99.100:9099']
- docker pull prom/prometheus will fetch the latest Prometheus image that which we need
- docker pull grafana/grafana will fetch the latest Grafana image that which we need (if needed)
- docker run -p 9090:9090 -v /C:/<---your local path--->/src/main/resources/prometheus.yml prom/prometheus
- docker run -d --name=grafana -p 3000:3000 grafana/grafana (if needed)
- Later head to your favourite browser and hit docker_ip_address:port_number_the_prometheus_image
example : 192.168.99.100:9090 - and you will be able to see prometheus UI
- Same for grafana, 192.168.99.100:30
Once you're on Prometheus UI which looks like below
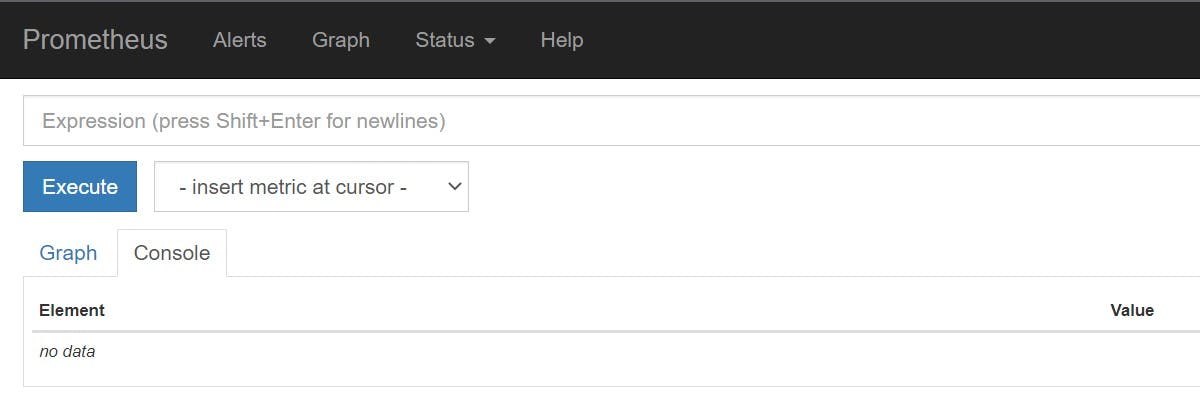
In the expression enter your custom metric name such as status_type_sent and hit execute, it will show the count being reflected in value field to the right side or you can click on graph!
That's it, I hope this is helpful, but again, prometheus is a lot more than just counters. Try to take a in depth look at this, this is indeed helpful for various insights!
Cheers ^_^